
Mall & Retail intelligence platform powered by digital twin & AI
AI-powered intelligence platform for malls & retail.
Bring footfall, Wi-Fi, sales, leasing, sensors, energy and operations onto one live indoor map - for malls, retail chains, hotels & airports. One live view of every space you run - and what to do next.
412 inside now
Footfall is tracking above the usual Thursday. Peak expected 19:00–20:00 - consider one extra cleaner on Level 1.
Works with what you already have.
Native connectors for people counting, Wi-Fi and indoor maps - plus CSV, signed webhooks and APIs for everything else. No rip-and-replace.
- XovisPeople counting
- VemcountPeople counting
- AislelabsWi-Fi analytics
- MappedinIndoor maps
- MicrosoftEntra ID, Teams
- AWSCloud
- and more →
Six disconnected systems. One intelligent control tower.
Counting, Wi‑Fi, sales, leases, meters and the operations team each live in their own tool. Axis joins them per site and per zone, so a drop in footfall, a late sales file and a lease expiry show up in the same place - next to the people who can act on them.
- 01 · Visitors
Visitor intelligence
Footfall by entrance and zone, live occupancy, dwell, repeat visits and Wi‑Fi demographics.
Footfall · Dwell · Repeat rate · Busy times · Heatmap
- 02 · Sales
Sales & tenants
Gross sales, conversion and basket by store and brand group, against target - with late submissions flagged.
Sales · Conversion · Basket · vs target · Heatmap
- 03 · Leasing
Leasing
Occupied, vacant and holdover units, an expiry timeline and rent performance, coloured on the floor plan.
Occupancy · Expiries · Rent / sqm
- 04 · Energy
Energy
Consumption against baseline and target, kWh per visitor, carbon and anomaly alerts by meter and space.
kWh · Intensity · Carbon · Anomalies
- 05 · Marketing
Events & attribution
Measured footfall lift for every event against a normal day. ROAS only where you entered the budget - never guessed.
Lift · Overlaps · ROAS
- 06 · Operations
Operations
Incidents, housekeeping, shifts, maintenance, checklists and complaints - run fully in‑house.
SLA · Work orders · Rosters · Service
Built for every kind of space
Same platform. Your kind of building.
Pick the modules that match how your space earns, spends and serves people.
Know which zones, tenants and events earn their keep.
Join footfall, Wi‑Fi, tenant sales and leasing per unit, then run the floor team from the same map.
- Tenant performance - sales, conversion and rent per sqm per unit
- Leasing - expiries and vacancies coloured on the plan
- Event lift - measured footfall against a normal day
- Operations - incidents, housekeeping and shopper complaints
- Footfall
- Sales
- Leasing
- Events
- Operations
Indoor digital twin
See the space the way it moves.
Every floor, every unit, on a live map. Switch between 2D plan and 3D tilt, layer occupancy, lease status, incidents and events - and scrub back through the day to see what happened when.
Bring your map any way you have it
- MappedinSync an existing venue map
- GeoJSONUpload floors and units
- Draw in AxisPolygons, unit tags, zones
AI in Axis - Insights & Forecasting
AI where it helps. Never where it guesses.
Axis does the maths; AI writes it up. Every figure in an insight is calculated from your data first, and checked again after the model has worded it.
- 01Your dataSensors, Wi‑Fi, sales, leases, meters
- 02Axis calculatesEvery figure computed on our servers
- 03AI writes it upYour Azure OpenAI or ours - words only
- 04Numbers checkedEach figure verified, or a rule‑based fallback
- Similar past days
- 6
- Expected footfall
- 28.4k
- 24.1k – 31.9k
- Suggested staff
- +6
- 4 cleaning · 2 security
- InsightsVerified insight cards
Plain‑language notes on every dashboard, with numbers that match the charts.
- BriefsDaily & weekly briefs
Emailed to each manager for their own sites, with a PDF to forward.
- ForecastsForecasts & scenarios
48‑hour outlook with ranges; compare a planned day with similar past days.
- StaffingForecast‑driven rosters
Suggested staffing from the forecast, pushed straight to shifts.
- AgentsMCP for your AI tools
Let your own assistants query Axis securely, with keys and usage audit.
- ControlYour model, your budget
Bring your own endpoint, cap daily usage, and switch AI off per tenant.
Operations
Run the floor in‑house, from the same screen.
Incidents, housekeeping, shifts, maintenance, checklists, lost & found and shopper complaints - a complete operations suite your own team runs. Use it with Axis analytics, or on its own.
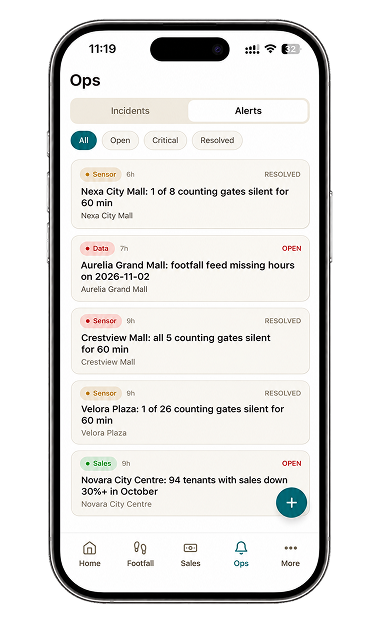
Axis mobile · iOS & Android
Every site, in your pocket.
The numbers that matter for every site you manage - from the car park, the mall floor or the airport lounge.
- Live visitors and occupancy
- Footfall by floor and zone
- Mall digital twin by store category
- Sales, leasing and incidents at a glance
- Download on theApp Store
- Get it onGoogle Play
Built for portfolios
Numbers your board can trust.
Every dataset gets a reliability grade from A to D - freshness, completeness and forecast accuracy - so nobody presents a number that came from a half‑loaded file.
- AFootfall · XovisFresh · 100% complete
- AWi‑Fi visitsFresh · 99% complete
- BTenant sales2 stores late
- CEnergy (CSV)Last upload 3 days ago
- Multi-site, multi-region
Portfolio roll-ups with country, region, city and site managers.
- Alerts where you work
Rules per site, delivered by email, Microsoft Teams or webhook.
- Open data
Data API, signed ingest webhooks and an embeddable live KPI ticker.
- Bring your AI agents
An MCP server lets your own AI tools query Axis, with keys and usage audit.
Enterprise-grade security
Your data is yours. We keep it that way.
Encryption, strict access control and a full audit trail - built in from the start, not bolted on.
Encryption
Data encrypted in transit and, where applicable, at rest. Connector credentials and SSO secrets are sealed with AES-256-GCM.
Role-based access
Least-privilege roles scoped by country, region, city and site, plus per-module, brand and operations-area grants.
Single sign-on
Centralised sign-in through Microsoft Entra ID (Azure AD).
Audit logging
Admin, API and AI-agent (MCP) activity is logged for review and compliance.
Tenant isolation
Each customer’s sites, users and data are scoped to their own tenant, with licence limits and controls.
Privacy by design
Aggregated, operational analytics - not individual identification. No facial recognition as a standard feature.
Live on your own data in days, not quarters.
Already have Xovis sensors or people counting software? A Mappedin map? We connect what you have - no rip‑and‑replace.
- Step 1 · Connect
Plug in your sources
Footfall cameras (Xovis) and counters (Vemcount), Wi-Fi analytics, tenant sales and leasing, energy meters - via native connectors, CSV or signed webhooks.
- Step 2 · Map
Build your twin
Sync from Mappedin, upload GeoJSON, or draw floors, zones and unit polygons right in Axis and tag each unit to its tenant.
- Step 3 · Run
Operate from day one
Dashboards, forecasts, alerts, briefs and the operations suite go live for your team - with a data‑trust grade on every number.
“RHA Axis has transformed the way we understand and manage our retail spaces. By bringing footfall, tenant performance, visitor movement, and operational insights into one intelligent platform, it gives our teams a unified view of the entire mall ecosystem. What once required multiple disconnected systems can now be accessed through a single control tower, helping us make faster, smarter, data-driven decisions.”